Animation conduit patterns

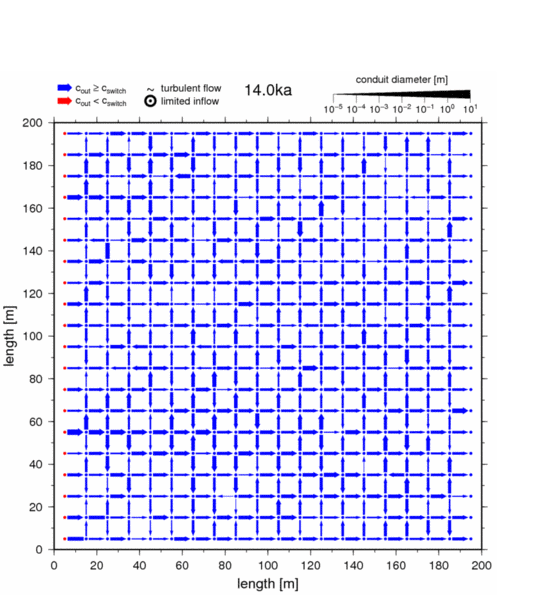
Example of an evolving conduit pattern in a network with initial protoconduit apertures that are spatially uncorrelated and log-normally distributed (mean aperture 0.5 mm, standard deviation 0.5 mm). Conduits are shown as arrows indicating the flow direction. The thickness of the arrows corresponds to apertures and tildes indicate turbulent flow. Red colour indicates high dissolution rates and fast enlargement. Flow is from left to right due to an initial head difference between left and right boundary of 5 m. The development of solution conduits causes an increase in flow rates. The increase of the inflow, however, is limited to a maximum of 5·10-5m3s-1 per node (indicated by the appearence of opened circles at the left boundary) and thus the head difference decreases once this flow rate is reached. More details are provided by Hubinger and Birk (2011).
Steffen Birk
 Institut für Erdwissenschaften
