time-space-diagrams II
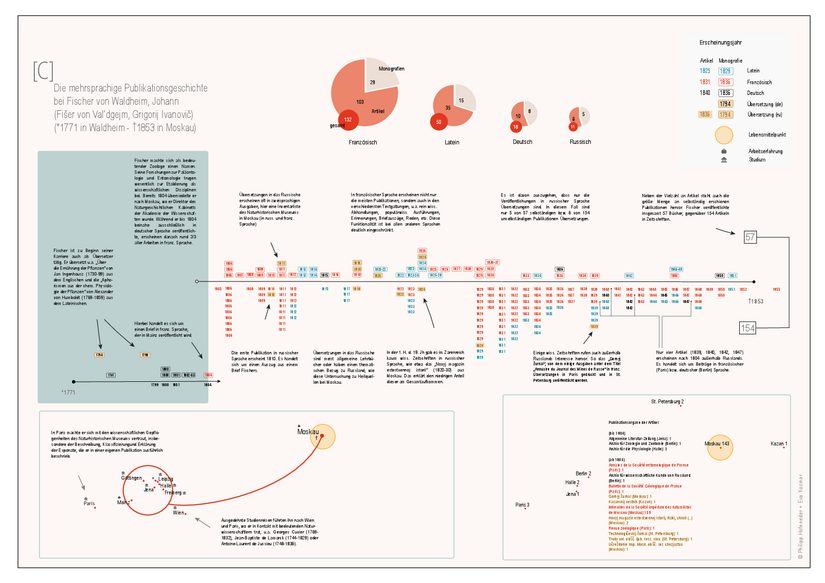
In many cases, newer data visualizations aim at the use of complex programs and thus computer-generated examples. For a comprehensive understanding of visualizations in the scientific field, it is necessary to also take up already established possibilities and adapt them if necessary. One possibility is the use of classical diagrams, which are characterized by a reduced and readable representation. In the present case, the publication volume of Johann Fischer von Waldheim, a 19th century natural scientist, was evaluated quantitatively. The chronological representation of his articles and monographs was extended by a spatial axis that refers to publications as well as the author. This makes it possible to reconstruct when Fischer von Waldheim published which works from where and in which language.
Citation form: Hofeneder, Philipp (2022) Space-time diagram on Johann Fischer von Waldheim, https://homepage.uni-graz.at/de/7/raum-zeit-diagramme-ii/
