network visualization
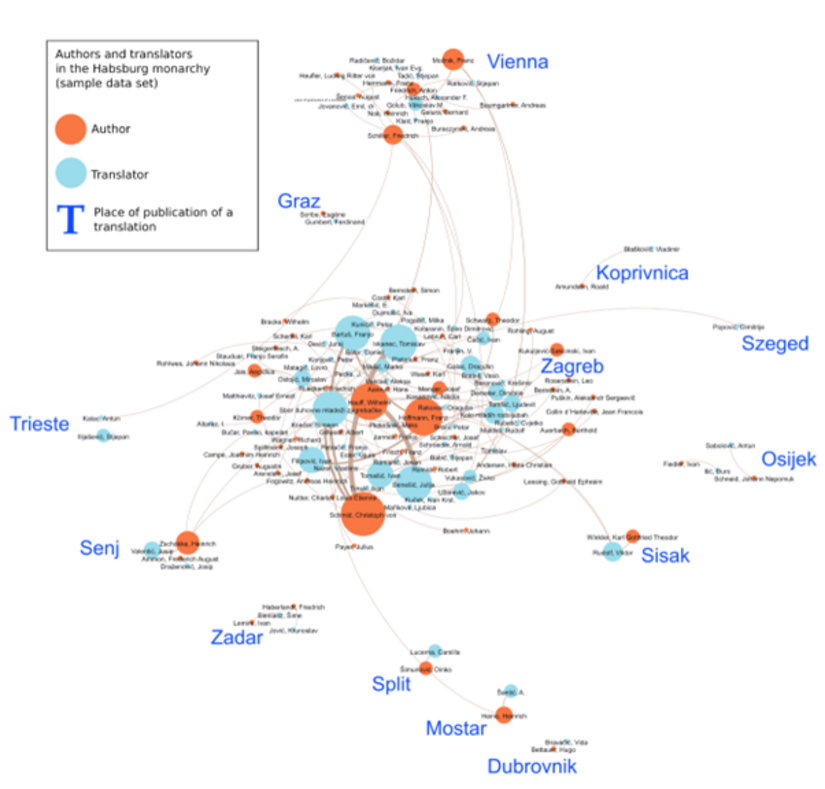
The following visualization, created by Sanja Sarić in collaboration with me, is a computer-generated network visualization based on the analysis of quantitative data on translators (from Croatian into German) in the Habsburg Monarchy between 1848 and 1918. The data was collected in the database "Deutsch-slowenische/kroatische Übersetzung 1848-1918" (Prunč et al. 2004-2008, translationswissenschaft.uni-graz.at/de/forschen/forschungsprojekte/deutsch-slowenischekroatische-uebersetzung-1848-1918).
First, the data was normalized using OpenRefine (https://openrefine.org/). This involved standardizing the spelling of the names, extracting information about the publication locations of the translations and assigning permanent identifiers to the individuals. The location data was enriched with geographical coordinates by performing a comparison via WikiData (https://www.wikidata.org), after which the data was prepared for the network analysis with Gephi. For the network analysis in Gephi, weights and modularity were calculated and algorithms such as Fruchteman Reingold, Force Atlas and Geo Layout were applied to visualize the result.
It shows a network of authors of the original works (orange nodes) and their translators (blue nodes) and contains information about the publication locations of the translations (via the position of the blue nodes), the number of occurrences of the respective person in the sample dataset (via the size of the node) and the frequency of the connection between individual authors and translators (via the strength of the edges).